
Understanding market trends and potential reversals is crucial for success in the dynamic world of trading. Volume indicators offer a wealth of insights into buying and selling pressure, providing traders with a comprehensive toolkit for informed decision-making. Let’s explore various volume indicating in trading with unique features and applications.
1- On Balance Volume (OBV)

1.1. Understanding OBV Calculation and Interpretation
On-Balance Volume (OBV) stands out as a leading indicator, offering a glimpse into market dynamics before price movements occur. Traders can leverage OBV to confirm trends and pinpoint potential reversals. Calculated by summing positive and negative volume flows over a specified period, OBV presents a straightforward yet powerful tool for traders.
1.2. OBV in Action: Decoding the Chart
As the OBV line ascends, it signals escalating buying pressure, while a descent indicates diminishing selling pressure. Traders can go beyond trend confirmation by comparing OBV with price movements. A rising OBV amidst declining prices suggests a shift in favor of buyers, presenting a strategic entry point for long positions.
1.3. Advanced Strategies with OBV
Venturing further, traders can use OBV as a leading indicator by observing crossovers with moving averages. While OBV lacks overbought and oversold levels, prudent integration with other indicators and comprehensive market analysis is imperative to avoid false signals.
1.4. Additional Tips
- Combine OBV with trendlines to identify potential trend reversals.
- Use OBV divergence with price movements for early signals of trend changes.
2- Volume Profile (VPT)
2.1. Navigating the Trading Waters with Volume Profile
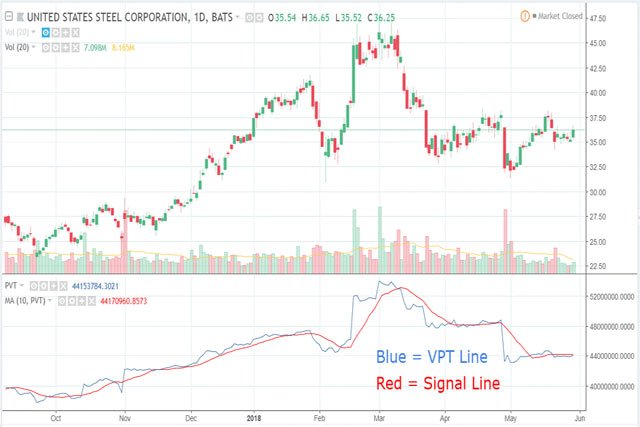
Volume Profile (VPT) offers a nuanced perspective, portraying trading activity at various price levels over a defined period. Unlike the simplicity of OBV, VPT’s bar chart unveils intricate details on volume distribution, aiding in the identification of support and resistance levels.
2.2. Customizing VPT for Your Trading Style
Traders wield control over VPT settings, tailoring the indicator to their preferences. Period, rows, width, ticks per row, and display options provide a spectrum of customization. The Developing Value Area feature adds another dimension, revealing evolving support and resistance levels.
2.3. Additional Tips
- Adjust VPT settings based on the market’s volatility for better accuracy.
- Use VPT in conjunction with trend analysis for a comprehensive view.
3- Volume Histogram (VH)
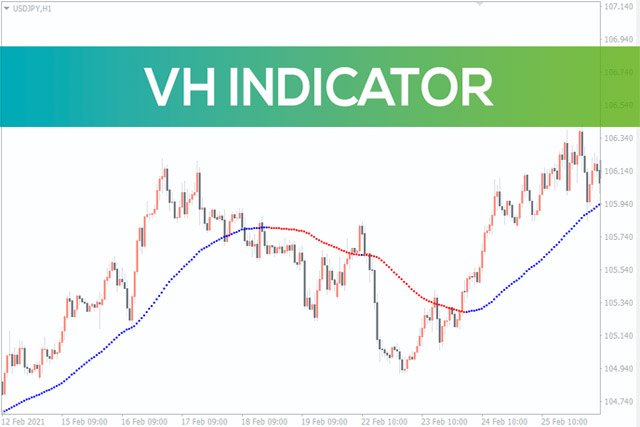
3.1. Illuminating Market Dynamics with Volume Histogram
Volume Histogram (VH) introduces a visual representation of buying and selling activity at different price levels. It serves as a built-in or custom indicator, enabling traders to pinpoint areas of significant pressure, paving the way for strategic decision-making.
3.2. Unveiling the Power of Histogram Customization
Unlike the moving average nature of OBV, VH takes the form of a histogram. Traders can fine-tune parameters, setting candle count, volume range, and timeframe for accurate depiction. Alerts further enhance usability, notifying traders of crucial histogram levels.
3.3. Additional Tips
- Set alerts for extreme points on the histogram to catch potential market reversals.
- Combine VH with other volume indicating in trading for confirmation signals.
4- Market Profile: Beyond the Basics
4.1. Unleashing Market Profile for Advanced Insights
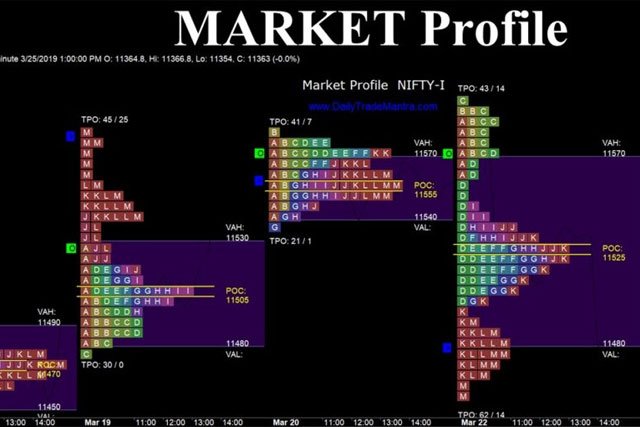
Market Profile, an advanced sibling to Volume Profile, organizes price data statistically based on both price and volume. While not readily available on Trading View, accessing it as a custom indication opens doors to understanding market liquidity and identifying key price levels.
4.2. Mastering Market Profile: Key Strategies for Success
Delving deeper into the Market Profile involves mastering key strategies for success. Analyzing statistical distributions based on both price and volume, traders can gain insights into market liquidity, identify crucial price levels, and make informed decisions. Combining Market Profile with other advanced tools can elevate your trading productivity to new heights.
4.3. Additional Tips
- Use Market Profile to identify areas of low and high liquidity for strategic entry and exit points.
- Combine Market Profile with traditional support and resistance analysis for a comprehensive approach.
5- Volume Weighted Moving Average (VWMA)
5.1. Elevating Trading Precision with VWMA
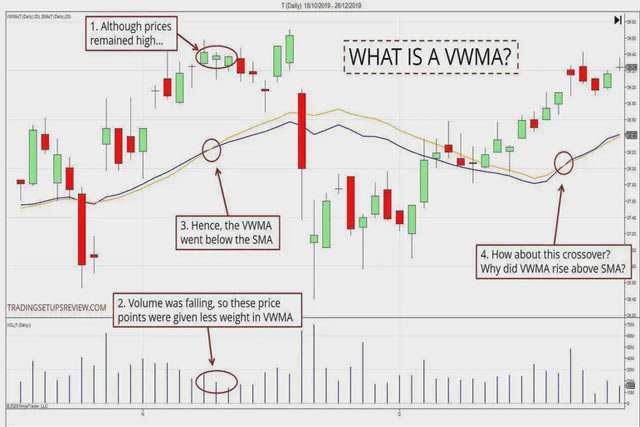
Volume Weighted Moving Average (VWMA) seamlessly integrates price and volume data, offering a nuanced view of market momentum. Traders can harness its power to identify trends, confirm reversals, and establish support and resistance levels.
5.2. Mastering VWMA: Customization and Caution
Unlike traditional moving averages, VWMA assigns varied weights to prices and volumes, enhancing its accuracy. Traders can tailor settings, choosing length, source, and offset. However, caution is vital as VWMA is a lagging indicator, necessitating collaboration with other indicators for confirmation.
5.3. Additional Tips
- Experiment with different lengths of VWMA to adapt to varying market conditions.
- Confirm VWMA signals with other momentum indicators for added reliability.
6- Adding Depth with Advanced Tools
6.1. Exploring Fibonacci Retracement
Fibonacci retracement is a powerful tool that adds depth to technical analysis. By identifying potential reversal levels based on the Fibonacci sequence, traders can gain insights into potential support and resistance zones.
6.2. Integrating Moving Average Convergence Divergence (MACD)
MACD, a versatile momentum indicator, can complement volume indicating in trading by revealing the strength of a trend and potential reversal points. Understanding MACD crossovers and divergences can enhance your ability to make informed trading decisions.
6.3. Additional Tips
- Look for MACD divergence with volume indicators on TradingView for robust trend confirmation.
- Use MACD histograms to identify changes in momentum strength.
Conclusion
As you continue your journey into indicating volume in the trading world, these additional tools and tips can provide a broader perspective and further refine your analysis. Moreover, they have the capability to streamline and automate various aspects of your business operations. Remember, a well-rounded approach to technical analysis involves integrating various indicators and strategies for a comprehensive understanding of market dynamics. Happy trading!
FAQs
How does On Balance Volume (OBV) differ from traditional volume indicators?
OBV focuses on cumulative volume flow, offering insights into buying and selling pressure. Unlike simple volume indicators, OBV’s emphasis on price movement correlation enhances trend confirmation.
Can I customize the Volume Profile (VPT) to suit my trading preferences?
Yes, VPT provides extensive customization options, allowing traders to adjust settings such as period, rows, width, and ticks per row. This flexibility ensures the indicator aligns with individual trading styles.
What advantage does the Volume Weighted Moving Average (VWMA) offer over traditional moving averages?
VWMA incorporates volume data, providing a more accurate representation of market momentum. Unlike traditional moving averages, VWMA assigns varied weights, offering a nuanced view of trend strength.
How can Market Profile be accessed on TradingView?
Market Profile is not a built-in indicator on TradingView, but it can be added as a custom indicator by following a provided link. This advanced charting study organizes price data based on both price and volume, offering insights into market liquidity.
Are there specific alerts or signals to watch for when using Volume Histogram (VH)?
Traders can set alerts for extreme points on the VH histogram to catch potential market reversals. Combining VH with other volume indicators enhances the ability to identify significant buying or selling activity.


